The latency scale label's leading digits don't display if I choose a Latency Scale of > 9999 in display options, or, if I use auto scaling and the latency exceeds 9999 in any display period. Example: 10000 displays as 0000, 10500 displays as 0500, etc.
Here's a screen capture snippet:
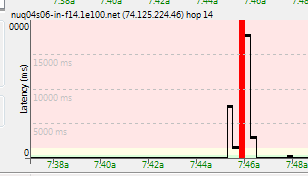
-- notice that the horizontal scale lines show 5000, 10000, and 15000 ms but the Latency Scale label at upper left is '0000' (I'd set a scale of 20,000 manually in this example.)
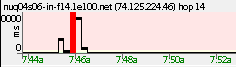
EDIT: and here's a snippet from an auto-saved PNG file (using the auto-save feature)
I'm troubleshooting a connection problem having occasional very high latencies (sometimes exceeding 15,000 msec!) so this has bitten me a few times.
This creates confusion when I try to save/send graphs to others for support purposes, as the scale label is clearly incorrect (something I need to call out/explain to the support staff.) Also, in auto-saved charts, the horizontal scale lines are not included, so the latency scale label is all we have to go on.
Is this a known issue? Are there any known workarounds?
Version and OS info:
PingPlotter v3.40.2s (though I've noticed this in older versions.)
Vista x64 Ultimate, Win 7 x64 Pro, etc.
All systems using standard display font scaling (96dpi/100%,) system fonts, and themes.


 Previous Topic
 Index
Index