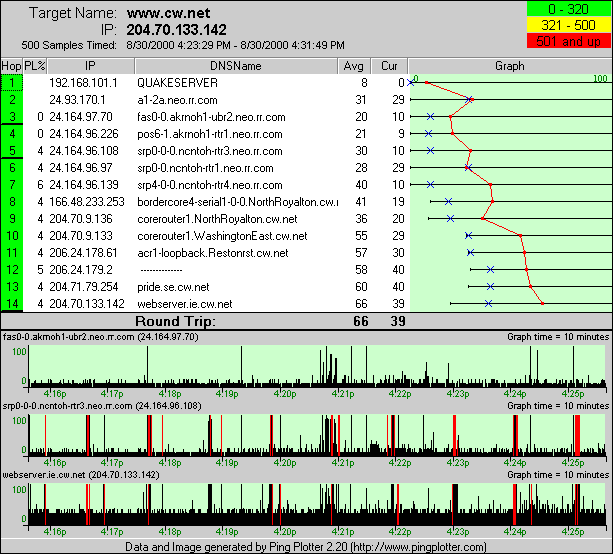
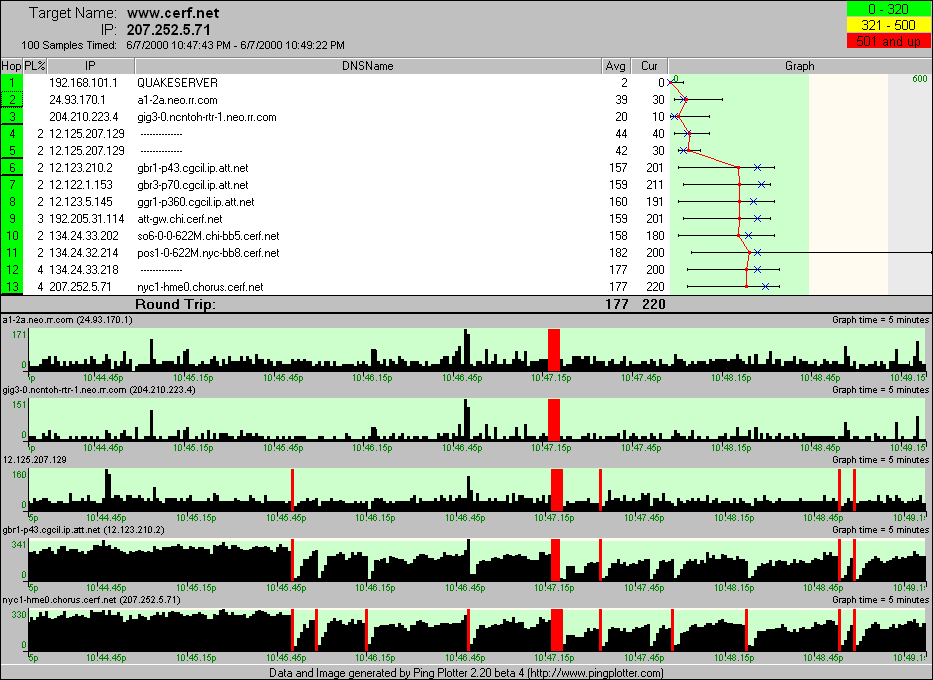
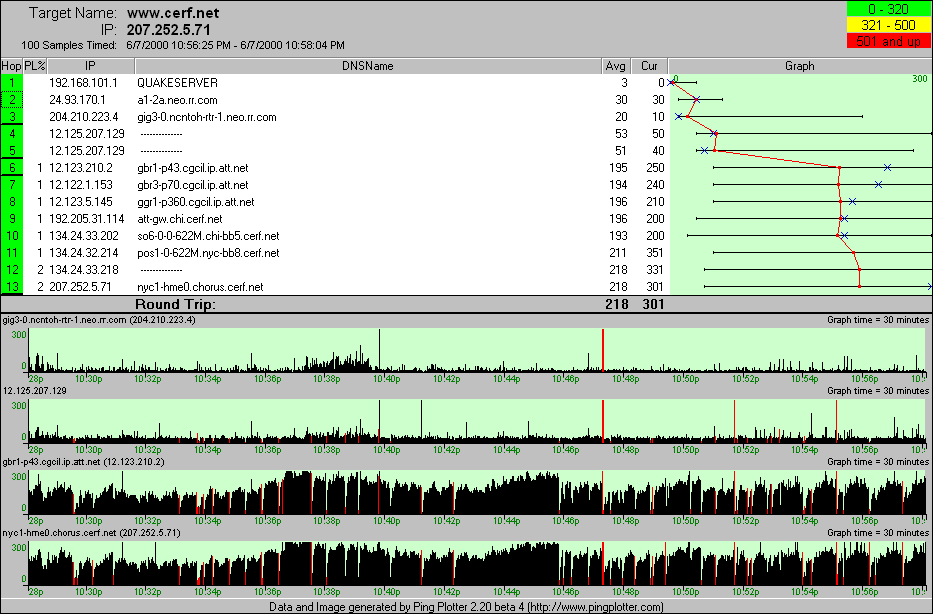
Hi.<br><br>While this isn't the first time I've seen this, I've yet to come up with any very good reasons for this happening. Here's some pictures I've created from my cable modem (since replaced by DSL) that showed some similar "cyclical" tendancies. I, also, was doing nothing on my network at the times these graphs were recorded - and had this behavior for consecutive days constantly in several cases.<br><br>Now the interesting thing about your information is that it doesn't seem to
directly translate into the final destination (notice how hop 12 on your graph seems relatively (but not entirely) unaffected by the problem). If you're looking to gather good ammunition, I'd try to find a time period where the "spikes" are visible in the final destination as well as some of the intermediate hops. If I were a network engineer confronted with data, I would be most concerned first with those issues where the end destination was noticably affected - as that's really the only thing that matters (heck, if all the hops through N-1 have 95% packet loss, but hop N has 0% packet loss and acceptable latency, then there's not really a problem).<br><br>If anyone else has any input on this "cyclical" problem, I'd be most interested to hear it. I pursued this with my ISP on 2 separate occasions with absolutely no resolution.<br><br>Sorry for the wide images, but it's easier to read that way...<br><br>
<br><br>
<br><br>
<br><br>


 Previous Topic
 Index
Index
