Hi jaredallen89,
Thanks for posting in the forums!
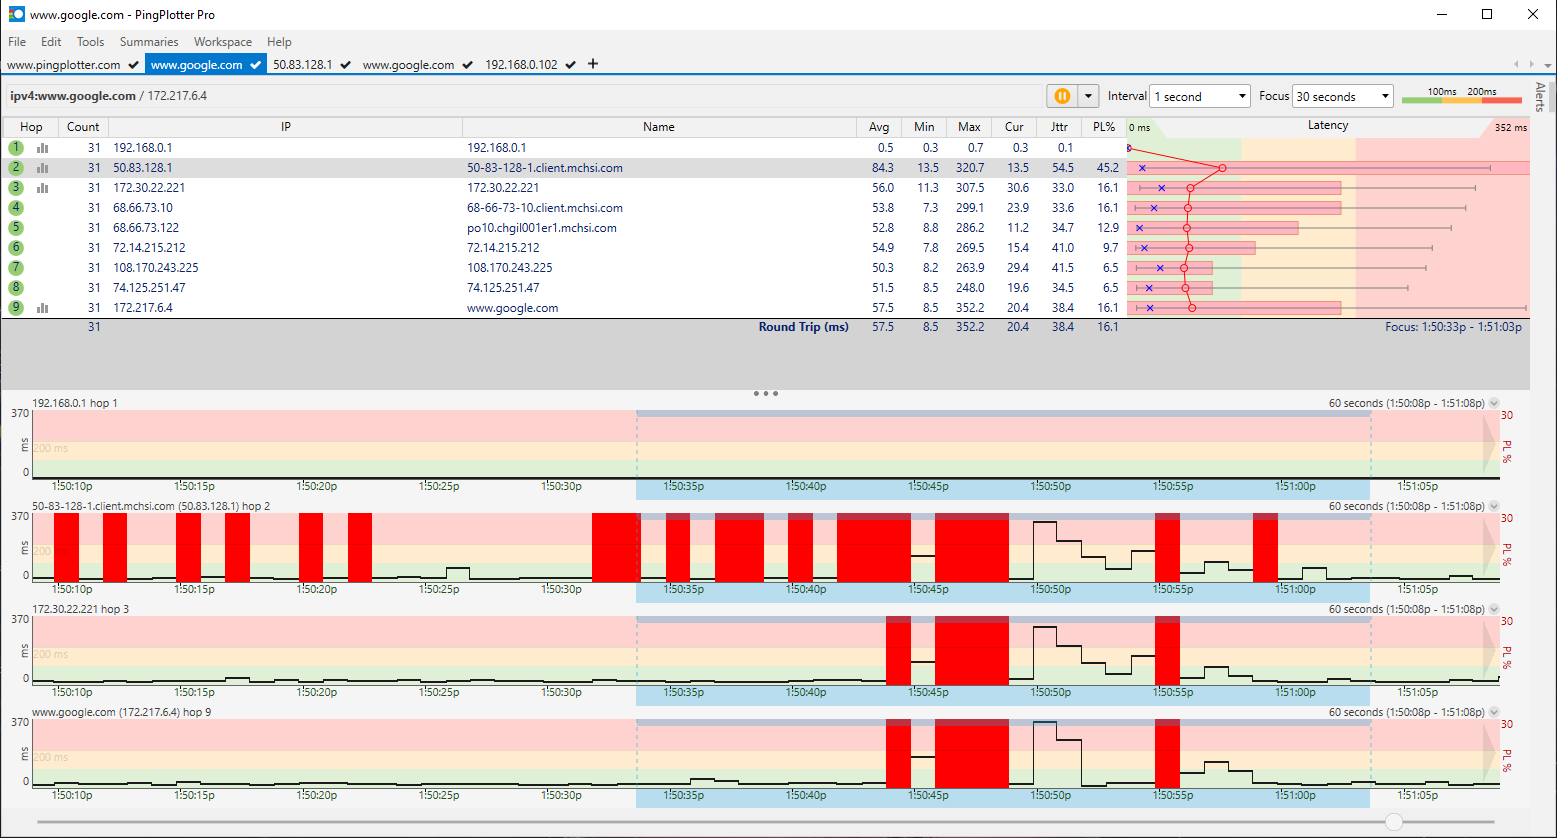
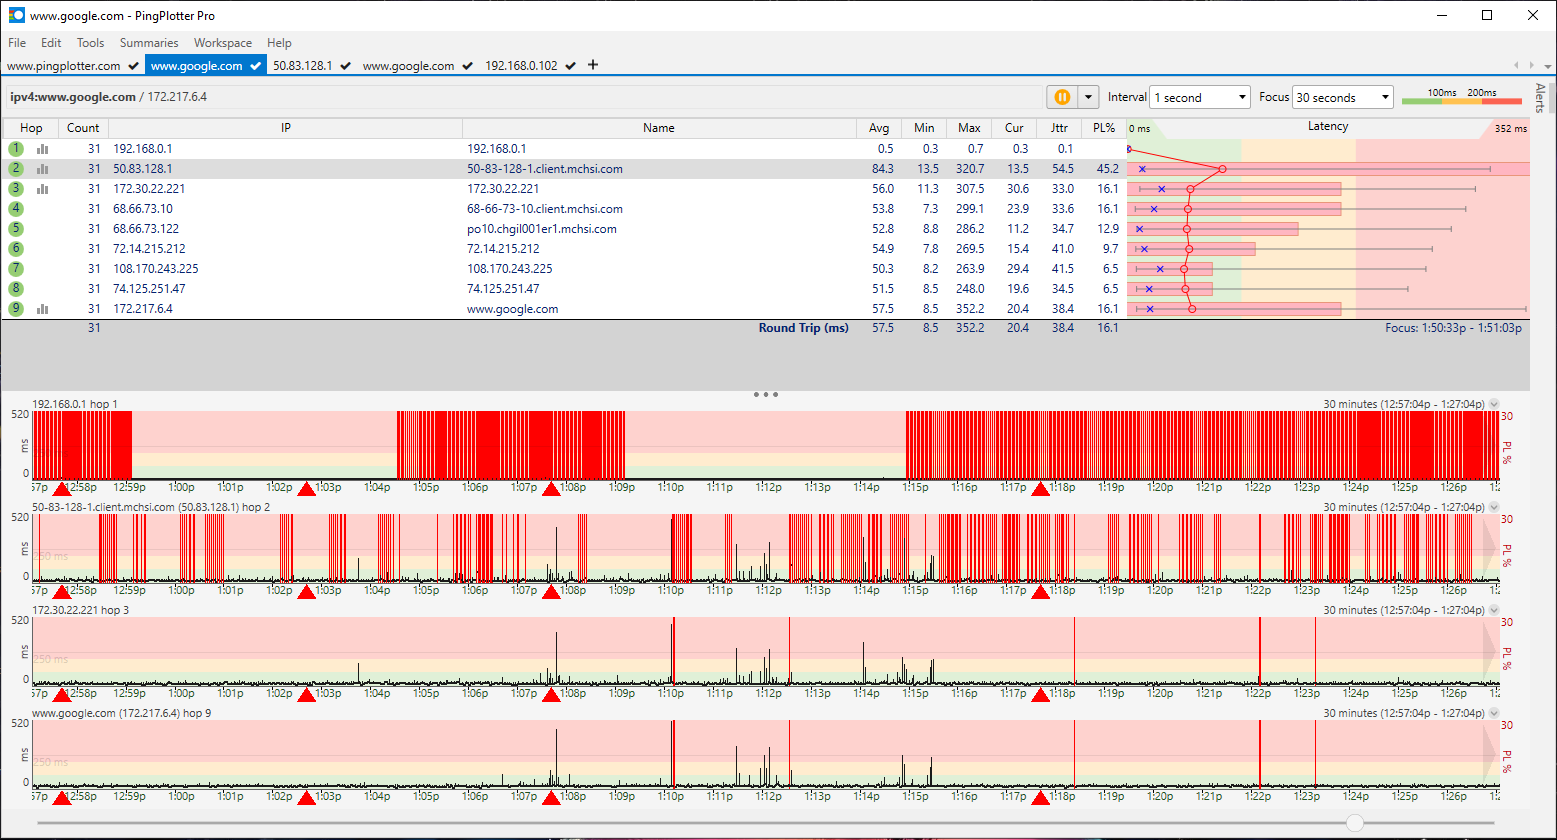
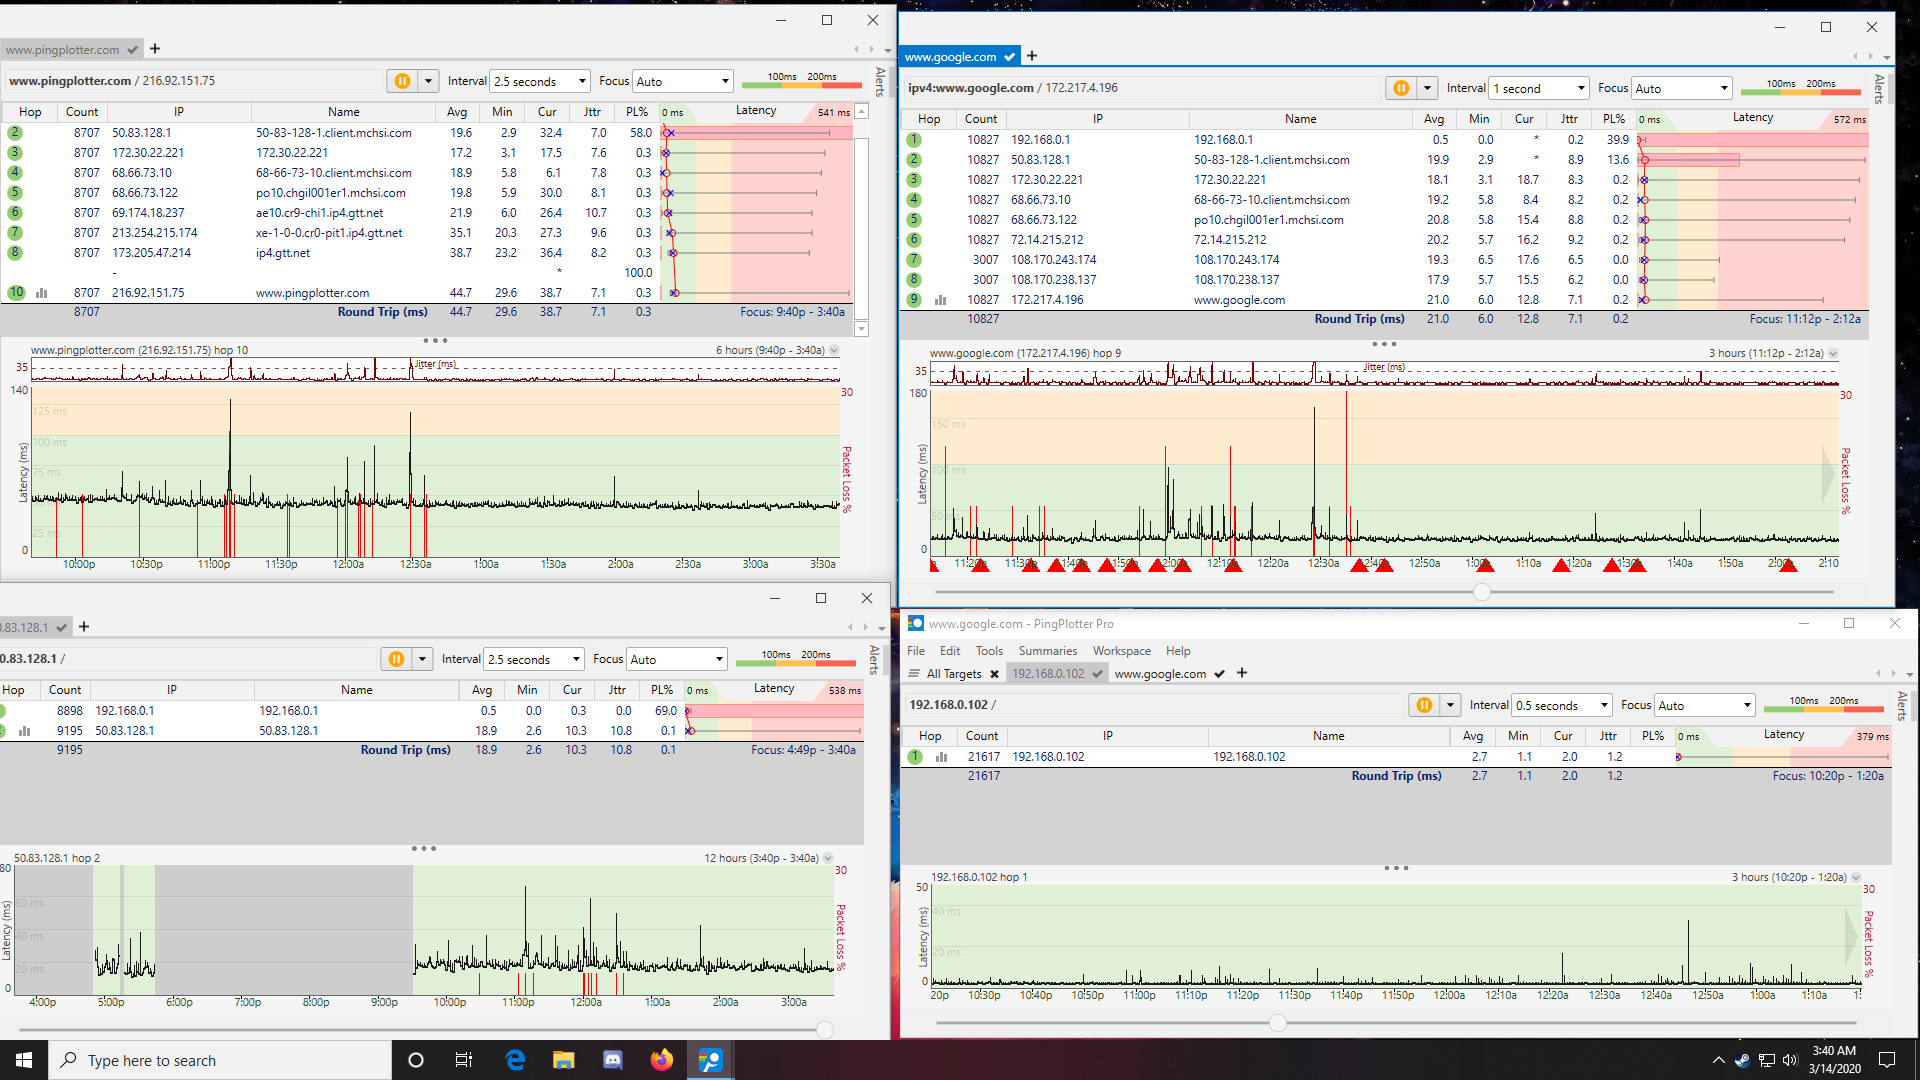
From your first couple of images, I would tentatively say that it's pretty clear that the issue starts at hop #2 but then I looked at the third image and it is a bit masked by the 39% packet loss on hop #1. I would say that rather than just sending your ISP screenshots we'd suggest sending them PP2 files so that they can look at the data over a 24-48 hr period and see the trends. Here is an article about
Building a solid case to present to your ISP.
We suggest gathering between 24-48 hrs of data so that you can really start to see the trends emerge. Here is a list of targets that we recommend that you trace to.
1. Trace to the
site or service you are having issues with (Netflix, Fortnite server, Zoom.com, etc.).
2. You can also trace to your
ISP (generally hop #2 or #3). A "WHOIS" google search on the IP address usually provides results about who the IP address is registered to.
3. To your
router (Usually the first hop in the route - 192.168.0.1 or something similar).
4. Trace to your
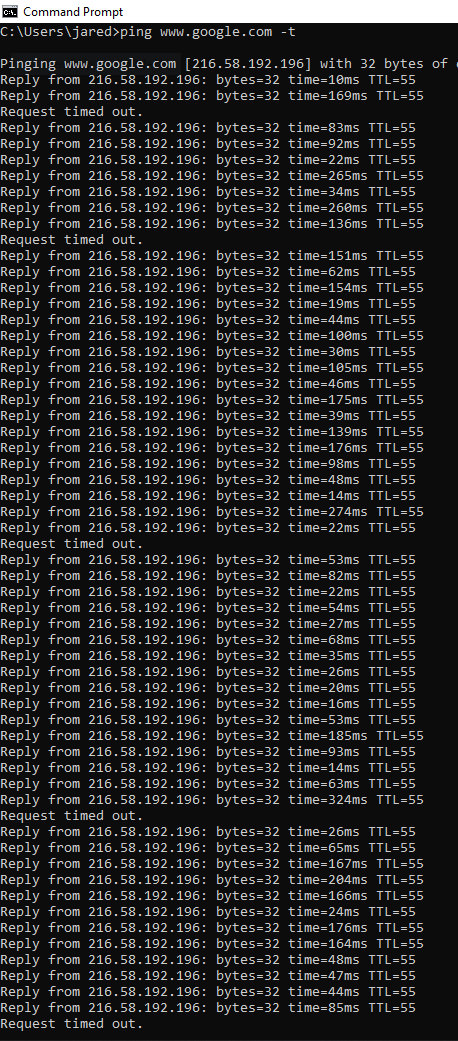
NIC (Network Interface Card). In Windows, run Command Line as administrator and type
ipconfig and look for the
IPv4 address - this is your NIC IP.
5. Finally, trace to your
loopback address (127.0.0.1). This lets you verify that any issues you are seeing are not related to the hardware or IP stack on the machine you're using.
You can share your results with us by changing your
Focus field to reflect at least
24-48 hours, clicking
File -> Share -> Create Share Page, and
paste the URL of your share page in your reply.
PingPlotter SharingHere are a few articles which talk about interpreting PingPlotter:
Interpreting Latency and Packet LossCommon Network ProblemsLet us know what you find and we'll be happy to give our two-cents.
Thanks,
-Poe


 Previous Topic
 Index
Index