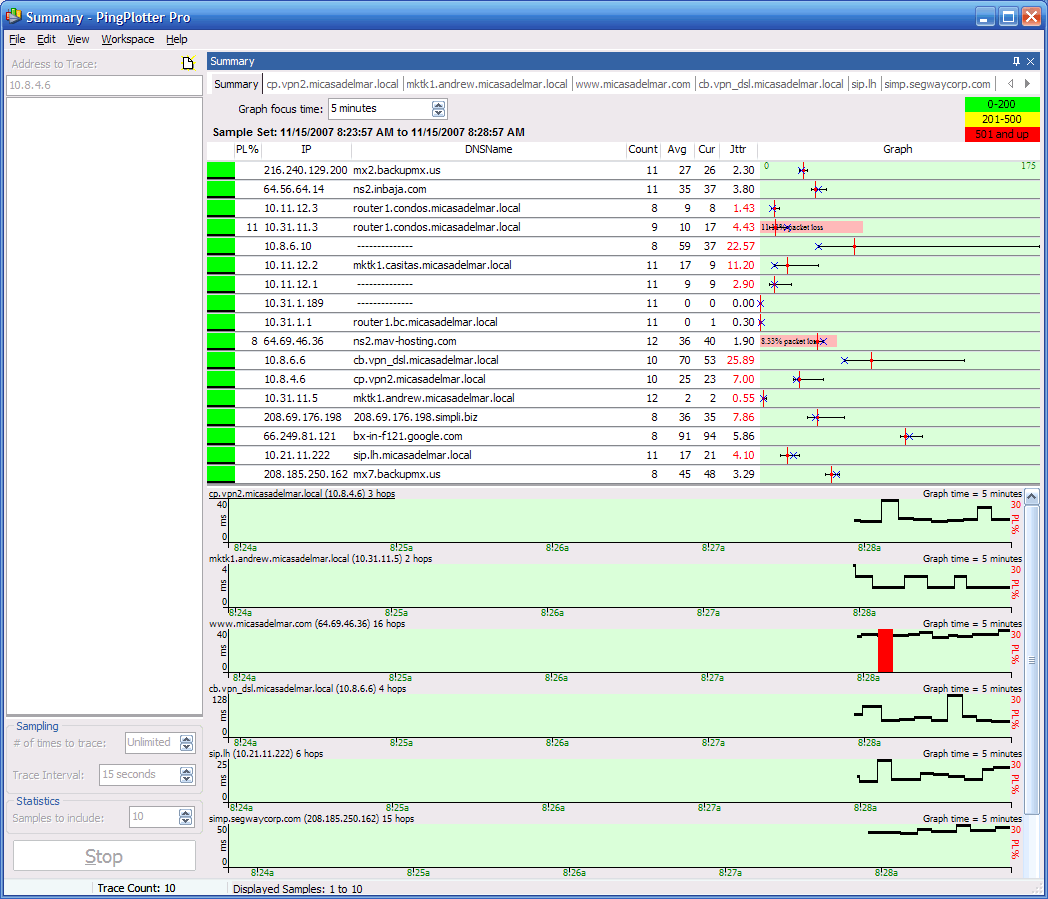
Not sure sending support a graph would work because this appears to be a UI problem, PingPlotter Pro does generate correct graphs if they are saved out.
I did delete the pingplotter.ini file with the same results.
I have attached some screen shots which may help:
pppro1.gif - summary screen - if you look at the right scroll bar, the bottom is missing.
pppro2.gif - single host screen - no time graph
pppro3.gif - same single host screen - window maximized, time graph appears
Looks like I can only attach one file to a post, I will make two more posts.
Thanks,
Brian
Attachments


